@jannabreslin
JANNA BRESLIN
Cover model to TV host who likes trucks & olive oil. Watch @modernhomesteadhq on Prime & join my 190k+ Outsiders on YT! ⛰️
@jannabreslin Profile Analysis Summary
Based on the last 12 posts
When we look at how jannabreslin's audience interacts with their content, we see an engagement rate of 0.71% — that's about 7.4K likes and 172 comments per post on average. For accounts in the 1M+ follower range, the typical rate is around 1.2%, so there's some room to grow here — but every audience is different.
Looking at content mix, about 100% of recent posts are videos and 0% are photos.
On the posting side, new content shows up roughly every 3 days — a moderately consistent rhythm. Captions tend to be moderate-length, averaging around 175 characters.
Key Metrics
1.1M
Followers
1.4K
Following
1.8K
Total Posts
0.71%
Engagement Rate
7.4K
Avg Likes
172
Avg Comments
Authority Score
Calculated from reach, engagement, content quality, and trust signals
Score Breakdown
1,060,618 followers
0.71% engagement rate
1763 posts, 172 avg comments
771.9:1 follower ratio
Verified account
Authority Score is an estimated metric based on 12 recent posts and public profile data. It reflects potential influence and engagement quality.
Industry Benchmark
88.2K
Total Likes
2.1K
Total Comments
Engagement Rate
Your engagement rate is 41% below the Mega (1M+) average. Consider experimenting with content formats, posting times, or engagement strategies.
Avg. Likes per Post
Your average likes are 91% below typical Mega (1M+) accounts. Focus on visual quality and trending topics.
Avg. Comments per Post
Your comments are 89% below the Mega (1M+) average. Try asking questions or creating discussion-worthy content.
Benchmarks are based on industry averages for accounts in similar follower tiers. Individual performance may vary based on niche, content type, and audience demographics.
Publishing Frequency
0.4
Posts per day
3
Posts per week
Monday
Most active day
Posts by Weekday
Top Performing Content

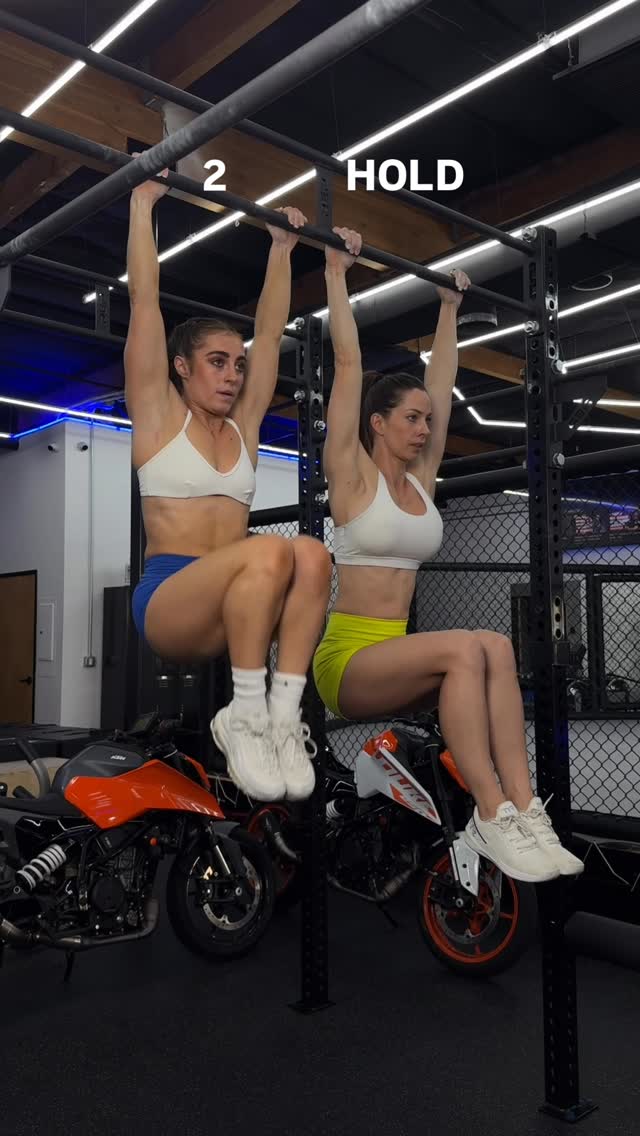
My new favvv parter ab challenge 👀 @demibagby @jannabreslin IB: @littletfitness @shaiross83
View on InstagramAnalyzed 12 posts. Top content receives 58.3K likes on average.
Content Type Analysis
Content Distribution
Videos
Photos
Videos outperform photos by 7.5K avg engagements per post.
Engagement Trend
Overall Trend
DecreasingComparing 6 older posts to 6 recent posts. Overall engagement has decreased by <span class="font-medium text-red-400">70.3</span>%
Likes Trend
-70.5%
Before: 11.4K avg
After: 3.4K avg
Comments Trend
-60.5%
Before: 246 avg
After: 97 avg
Total Engagement
-70.3%
Before: 11.6K avg
After: 3.4K avg
Caption Length Analysis
Caption Length Distribution
Average caption length: 175 characters. Short captions (1-100 chars) perform best with 15.8K avg engagements.
Hashtag Performance
With Hashtags
7
posts
Without Hashtags
5
posts
Most Used Hashtags
Average 2.4 hashtags per post. Posts with hashtags get 8.5K more avg engagements.
Growth Indicators
Account Classification
Mega InfluencerWith 1.1M followers, this account falls in the Mega category (1M-10M). Typical engagement for this tier: 0.2-0.5%
Following/Followers
0.001
ExcellentEngagement Rate
0.71%
Above averageTotal Followers
1.1M
Following 1.4K- • Very influential - follows far fewer than followers
- • Engagement rate is above the 0.2-0.5% benchmark for mega accounts
- • Average of 7.4K likes and 172 comments per post
Hashtags & Captions
Top Hashtags
Based on 12 recent posts
Top Caption Words
Common words filtered out for relevance
Content Themes
Content Mood
The overall tone of this profile's content leans towards neutral & informative with elements of romantic & emotional.
Food & Cuisine
Food-related content and culinary experiences
Travel & Adventure
Content related to travel destinations and adventures
Business & Motivation
Entrepreneurship and motivational content
Entertainment & Music
Entertainment, music, and nightlife content
Themes and mood are estimated by analyzing keywords in 12 public post captions and hashtags.
Audience Insights
Limited Data Available: Detailed audience demographics (country, age, gender) are only accessible to account owners through Instagram Insights. The data below is estimated from public content analysis.
Content Languages
Detected from 12 post captions
Audience Engagement
Based on likes-to-followers ratio
1M+ followers
Estimated based on average engagement × 3
Audience Summary
This established account shows low engagement with primarily English content. Average post reaches an estimated 22.1K accounts.
Best Time to Post
Best performing time: Thursday 4pm
Posts during this time get highest average engagement
Based on engagement patterns from 12 posts with timestamps.
AI-Powered Analysis Summary
Key insights and performance highlights based on @jannabreslin's recent content
@jannabreslin's engagement rate of 0.71% is low compared to similar accounts. This indicates a low level of audience interaction and content effectiveness.
Content strategy is 100% focused on videos, which appears to be the strongest performing format for this profile.
Posting consistency is medium with an average interval of 3 days between posts. medium frequency typically leads to better audience retention.
Best performing video generated 7.9x more engagement than average posts, suggesting strong resonance with specific content themes.
Caption strategy follows a moderate approach with an average of 175 characters. This moderate style aligns well with audience expectations for this account type.
This analysis is generated from publicly available data and provides estimated insights. Actual performance metrics may vary.
Explore Similar Public Profiles


Important Notice
All insights shown here are estimated using publicly available data. This tool is not affiliated with Instagram or Meta and does not access private information. Analytics are provided for informational purposes only and may not reflect actual account performance.