@puretropix
Pure Tropix Natural Skin Care
👩🏾⚕️ Products Formulated for Tropical Skin 📍Based in Atlanta ✊🏾 Black Owned 🌴 Your skin deserves a vacay! 🌺
@puretropix Profile Analysis Summary
Based on the last 12 posts
When we look at how puretropix's audience interacts with their content, we see an engagement rate of 1.56% — that's about 2.2K likes and 257 comments per post on average. For accounts in the 100K-500K follower range, the typical rate is around 1.8%, so there's some room to grow here — but every audience is different.
Looking at content mix, about 42% of recent posts are videos and 58% are photos. Interestingly, photo content tends to spark 8.8x more interaction than videos — worth noting for anyone studying this account's strategy.
On the posting side, new content shows up about every 129 days — a infrequent rhythm. Captions tend to be moderate-length, averaging around 197 characters.
Key Metrics
159.2K
Followers
3.1K
Following
2.7K
Total Posts
1.56%
Engagement Rate
2.2K
Avg Likes
257
Avg Comments
Authority Score
Calculated from reach, engagement, content quality, and trust signals
Score Breakdown
159,182 followers
1.56% engagement rate
2699 posts, 257 avg comments
51.5:1 follower ratio
Building credibility
Authority Score is an estimated metric based on 12 recent posts and public profile data. It reflects potential influence and engagement quality.
Industry Benchmark
26.7K
Total Likes
3.1K
Total Comments
Engagement Rate
Your engagement rate is 13% below the Mid-tier (100K-500K) average. Consider experimenting with content formats, posting times, or engagement strategies.
Avg. Likes per Post
Your average likes are 72% below typical Mid-tier (100K-500K) accounts. Focus on visual quality and trending topics.
Avg. Comments per Post
Your comment engagement is typical for Mid-tier (100K-500K) accounts. Maintain your current interaction strategy.
Benchmarks are based on industry averages for accounts in similar follower tiers. Individual performance may vary based on niche, content type, and audience demographics.
Publishing Frequency
0.0
Posts per day
0
Posts per week
Monday
Most active day
Posts by Weekday
Top Performing Content
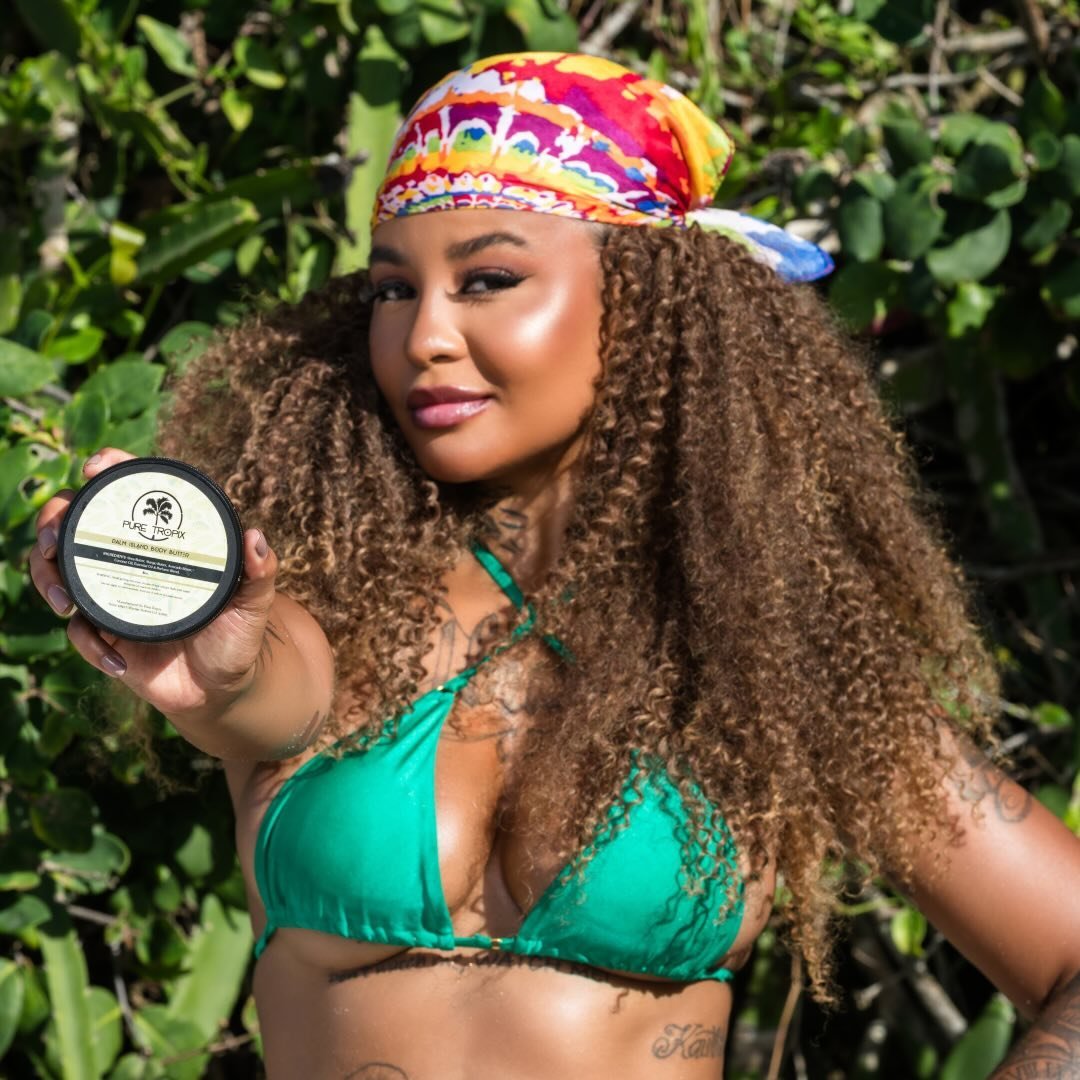
Even when it’s raining in LA you can still take your skin to paradise 🌧️🌺🥥 @puretropix With ingre...
View on Instagram
God is not asking you to tiptoe into this month. He is calling you to stretch. Believe bigger. The o...
View on Instagram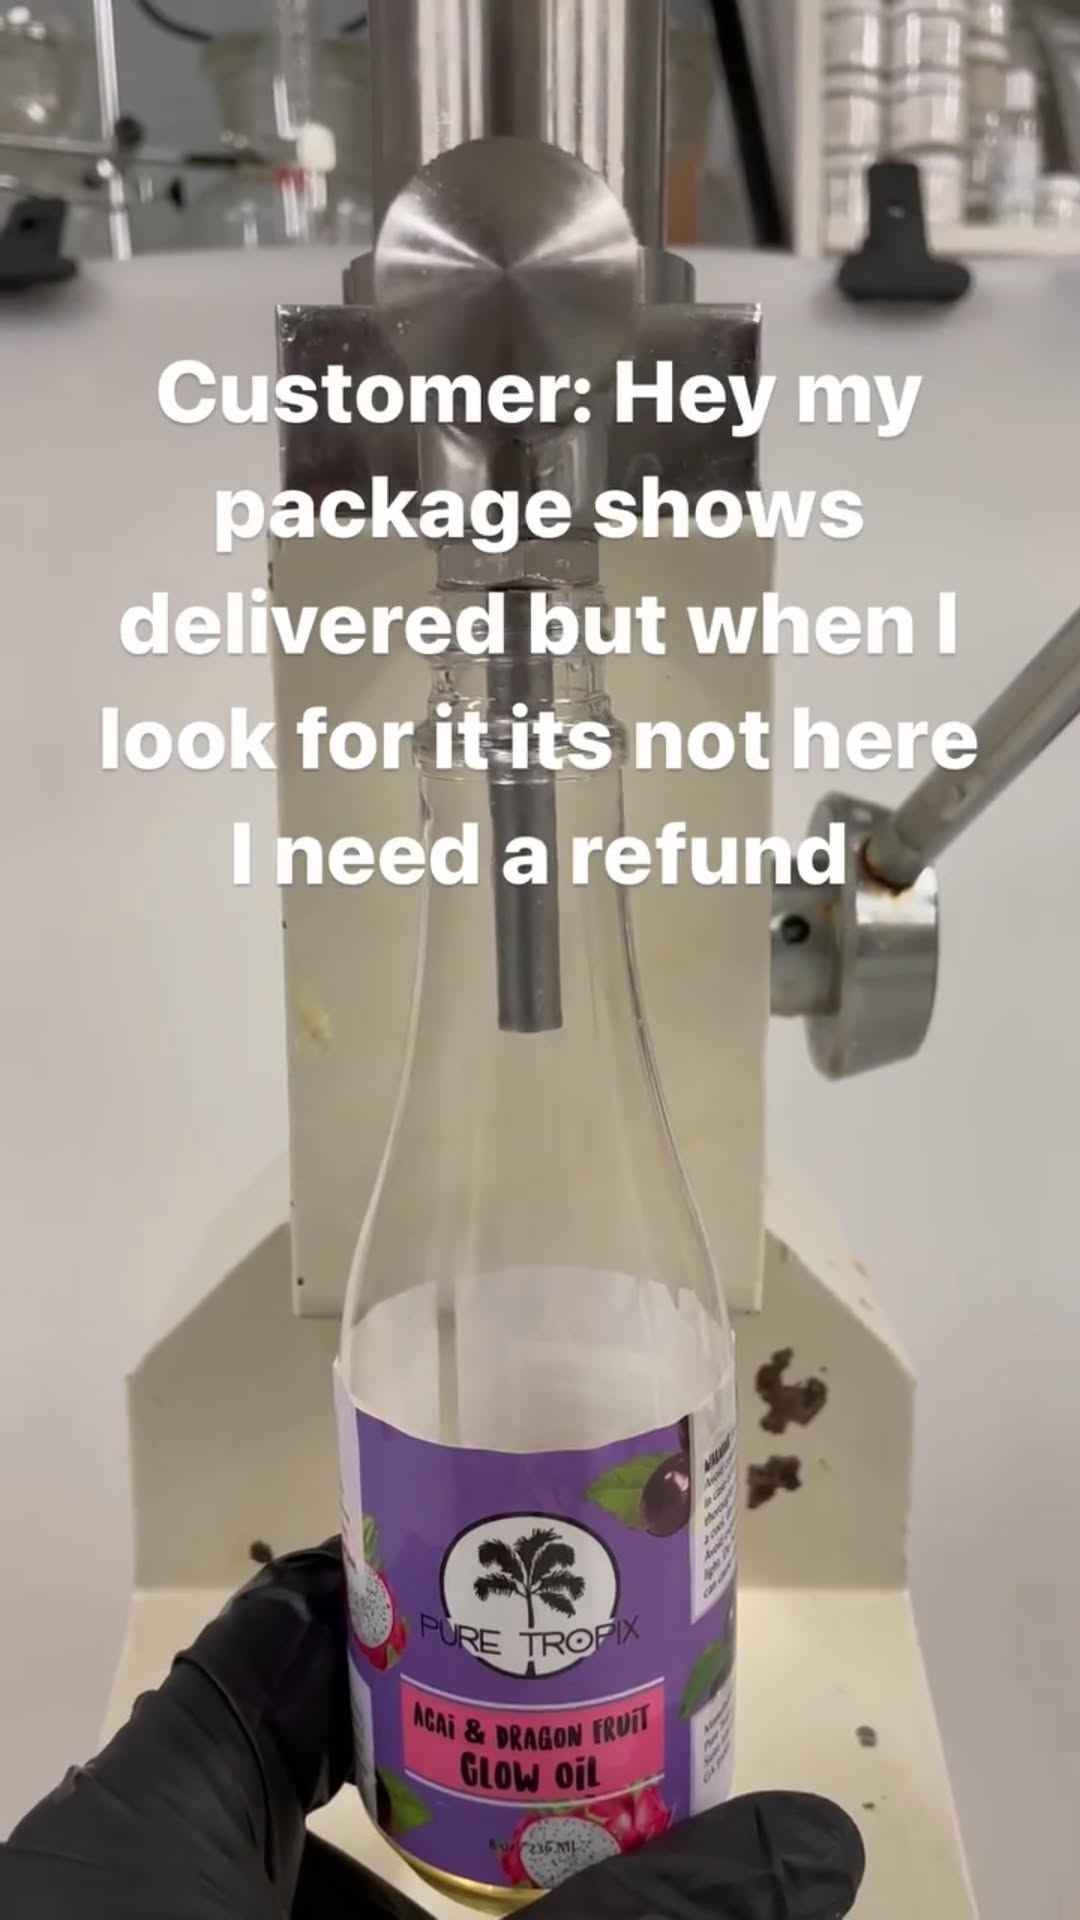
Reading dms as i fill up these products! 🚩🚩🚩🚩 The last 3 orders from her all showed delivered & ...
View on InstagramAnalyzed 12 posts. Top content receives 15.9K likes on average.
Content Type Analysis
Content Distribution
Videos
Photos
Photos outperform videos by 3.5K avg engagements per post.
Engagement Trend
Overall Trend
DecreasingComparing 6 older posts to 6 recent posts. Overall engagement has decreased by <span class="font-medium text-red-400">50.2</span>%
Likes Trend
-62.1%
Before: 3.2K avg
After: 1.2K avg
Comments Trend
+388.2%
Before: 87 avg
After: 426 avg
Total Engagement
-50.2%
Before: 3.3K avg
After: 1.6K avg
Caption Length Analysis
Caption Length Distribution
Average caption length: 197 characters. Medium captions (101-500 chars) perform best with 2.9K avg engagements.
Hashtag Performance
With Hashtags
6
posts
Without Hashtags
6
posts
Most Used Hashtags
Average 2.0 hashtags per post. Posts without hashtags perform 4.3K better on average.
Growth Indicators
Account Classification
Medium InfluencerWith 159.2K followers, this account falls in the Medium category (50K-500K). Typical engagement for this tier: 1-3%
Following/Followers
0.019
ExcellentEngagement Rate
1.56%
Above averageTotal Followers
159.2K
Following 3.1K- • Very influential - follows far fewer than followers
- • Engagement rate is above the 1-3% benchmark for medium accounts
- • Average of 2.2K likes and 257 comments per post
Hashtags & Captions
Top Hashtags
Based on 12 recent posts
Top Caption Words
Common words filtered out for relevance
Content Themes
Content Mood
The overall tone of this profile's content leans towards romantic & emotional with elements of neutral & informative.
Beauty & Skincare
Beauty tips and skincare routines
Nature & Environment
Posts featuring natural landscapes and wildlife
Entertainment & Music
Entertainment, music, and nightlife content
Lifestyle & Fashion
Content about lifestyle, fashion, and personal style
Themes and mood are estimated by analyzing keywords in 12 public post captions and hashtags.
Audience Insights
Limited Data Available: Detailed audience demographics (country, age, gender) are only accessible to account owners through Instagram Insights. The data below is estimated from public content analysis.
Content Languages
Detected from 12 post captions
Audience Engagement
Based on likes-to-followers ratio
100K-1M followers
Estimated based on average engagement × 3
Audience Summary
This established account shows average engagement with primarily English content. Average post reaches an estimated 6.7K accounts.
Best Time to Post
Best performing time: Thursday 8pm
Posts during this time get highest average engagement
Based on engagement patterns from 12 posts with timestamps.
AI-Powered Analysis Summary
Key insights and performance highlights based on @puretropix's recent content
@puretropix's engagement rate of 1.56% is average compared to similar accounts. This indicates a average level of audience interaction and content effectiveness.
Content strategy is 58% focused on photos, which appears to be the strongest performing format for this profile.
Posting consistency is low with an average interval of 129 days between posts. low frequency typically leads to better audience retention.
Best performing photo generated 6.5x more engagement than average posts, suggesting strong resonance with specific content themes.
Caption strategy follows a moderate approach with an average of 197 characters. This moderate style aligns well with audience expectations for this account type.
This analysis is generated from publicly available data and provides estimated insights. Actual performance metrics may vary.
Explore Similar Public Profiles


Important Notice
All insights shown here are estimated using publicly available data. This tool is not affiliated with Instagram or Meta and does not access private information. Analytics are provided for informational purposes only and may not reflect actual account performance.